NgSurvey Reports Engine
NgSurvey comes with built-in reporting engine which allow you to visualize the user responses to the survey. The reports can be accessed by clicking on the View Reports link shown below the surveys listing page in your administration screen.
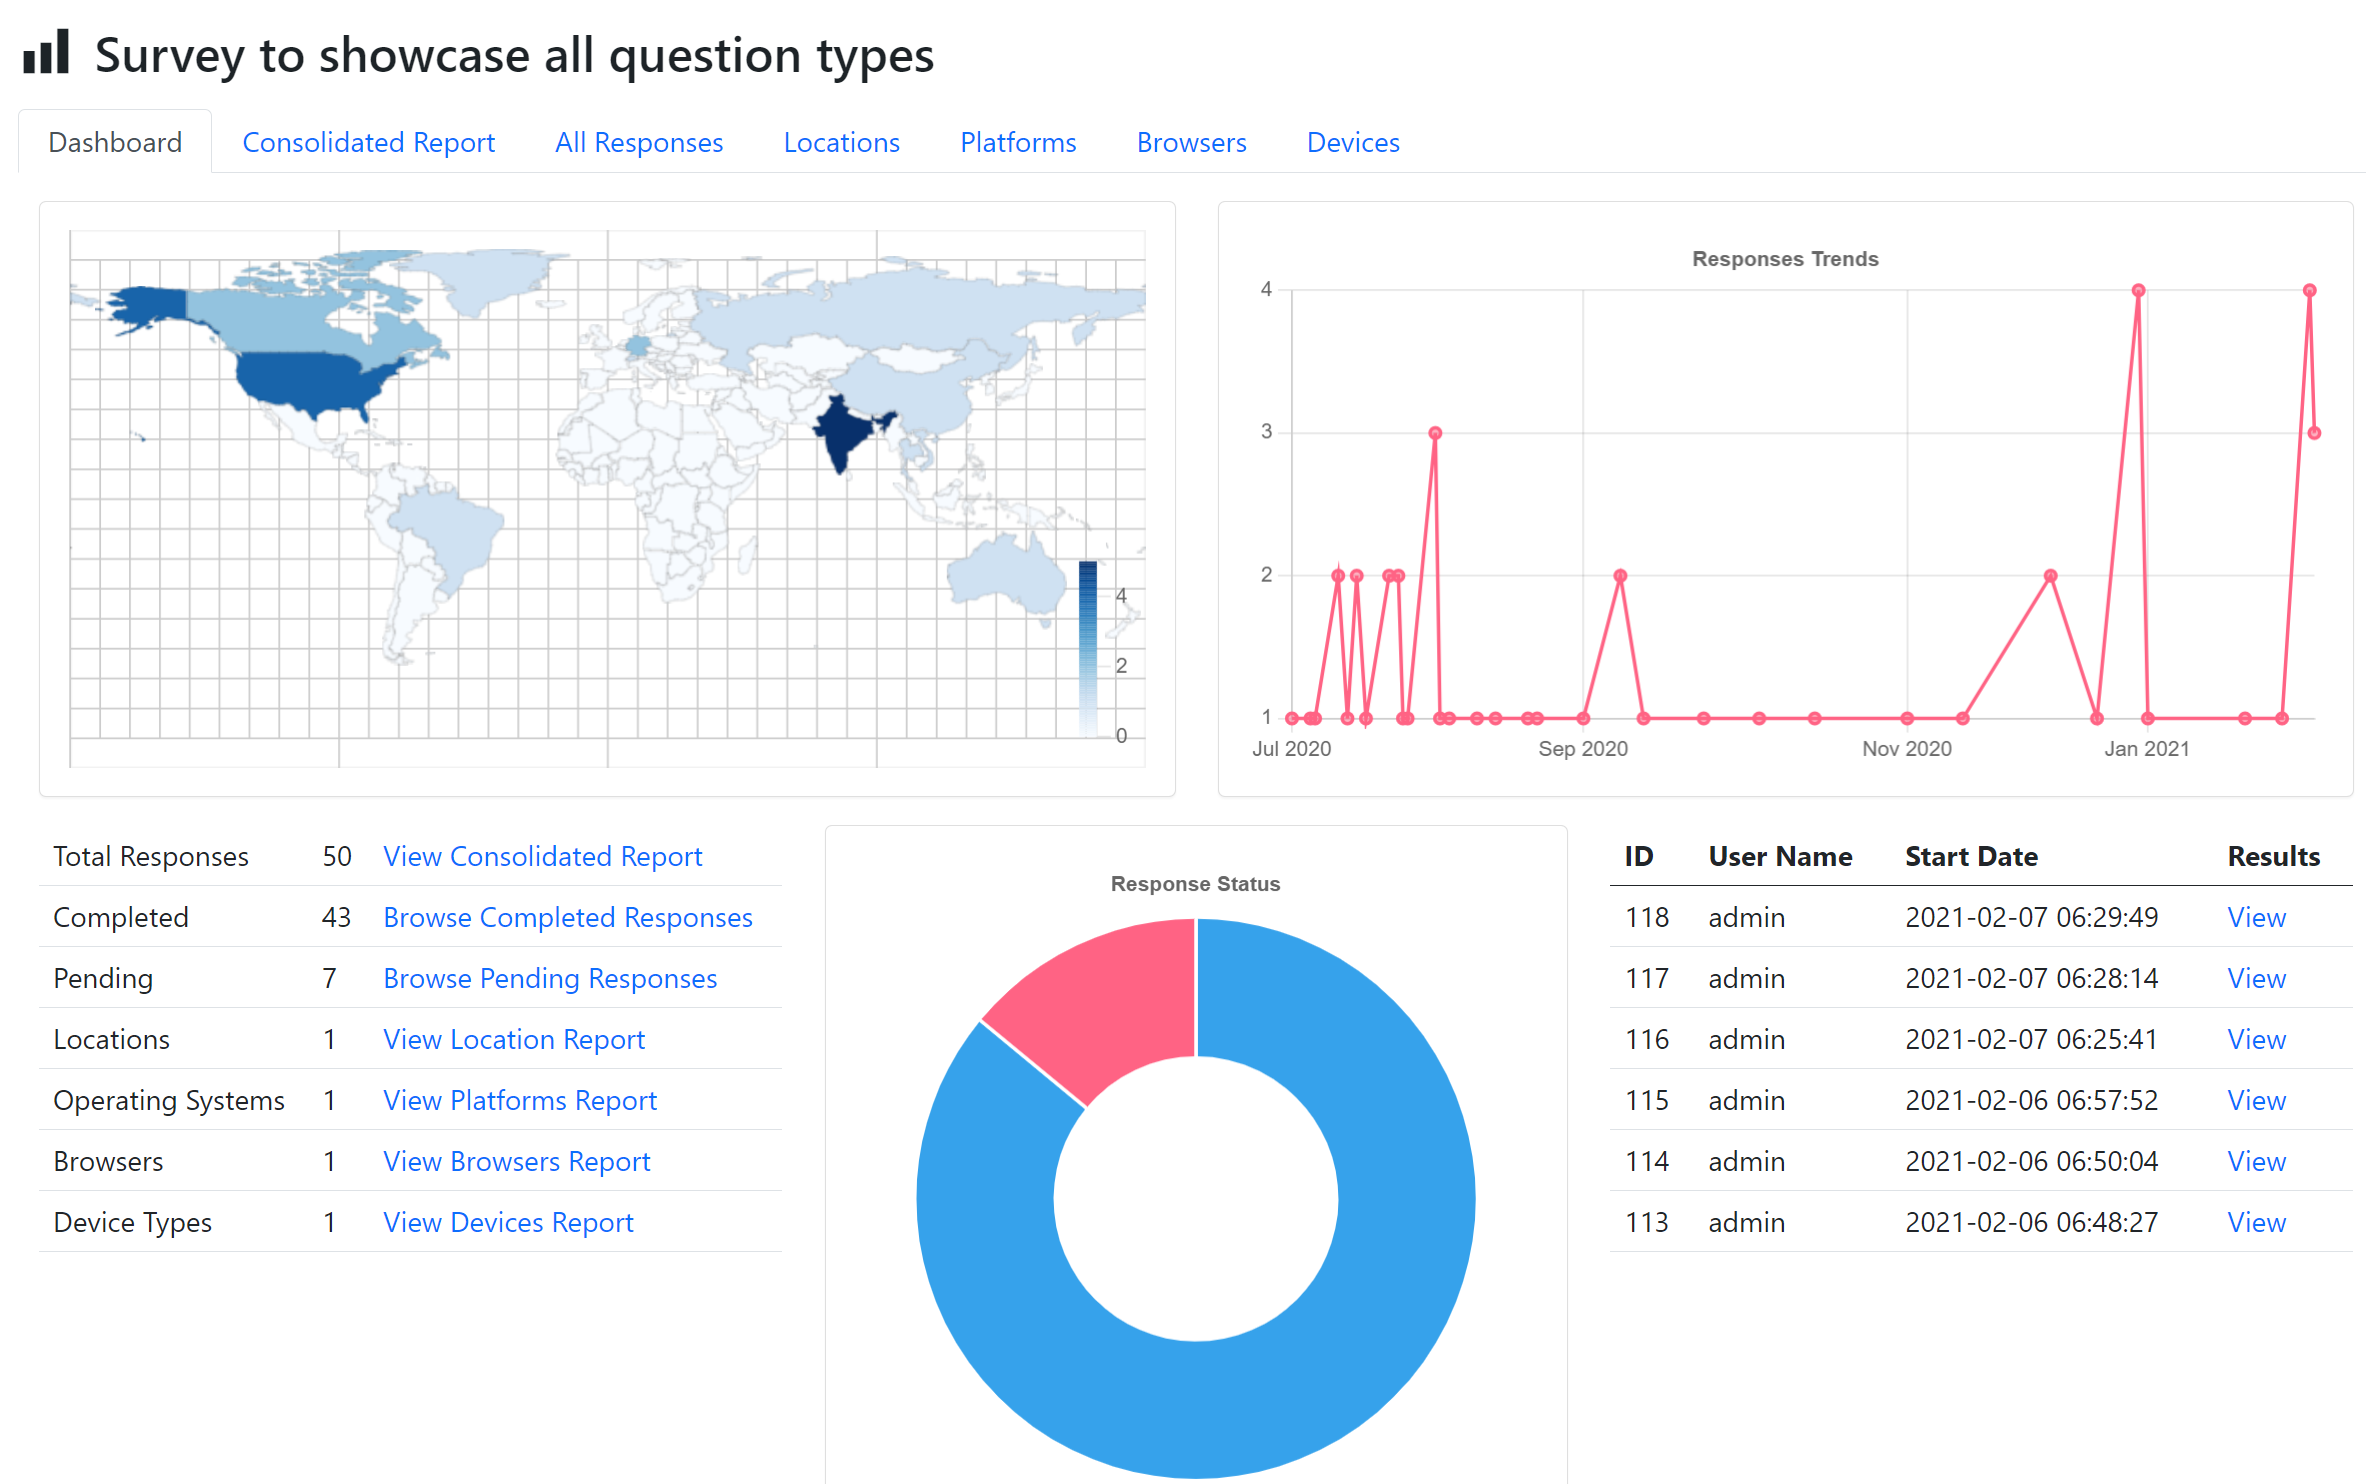
The reports dashboard shows quick overview of your survey and provides access to all important links. Following is the quick view of the dashboard.
There are many reports available in the reports engine as shown below.
- Consolidated report – this report shows the consolidated view of all the responses of the survey. Each question is presented in the charts and detailed information. You can view custom responses of the questions in this report. The reports are displayed in different format based on the question type.
- All Responses – If you are looking for accessing individual responses, this is the right place. You can view list of all responses recieved to the survey and view each individual response from here. If you are using CSV Download Extension, you can download all responses in a CSV file as well.
- Locations – If you are using MaxMind GeoIP extension for NgSurvey, this report will show consolidated view of the locations from where the users are responded to the survey. It includes detailed view of how many responses recieved per country, state/administrative region and the city. The report is presented in bar and pie charts apart from detailed tabular view.
- Platforms – This report shows the detailed report on what all operating systems and their versions used by the respondents of the survey. The report is presented in bar and pie charts apart from detailed tabular view.
- Browsers – This report shows the detailed report on browser names, version and browser engine used by the respondents of the survey. The report is presented in bar and pie charts apart from detailed tabular view.
- Devices – If you would like to know what type of devices your users are using to respond to the survey, then this is the right report. It shows how many users using desktops or mobile devices.